


Why Is ETH Price Struggling to Break $1,920?
Why Is Ethereum’s MVRV Ratio Alarming?

Ethereum (ETH) recently held above the $1,800 support level and attempted a recovery, similar to Bitcoin. The price climbed past $1,850 and $1,880, reaching a high of $1,955 before facing resistance. A key trendline break pushed ETH lower, forming a low at $1,781. Currently, ETH is consolidating near the 23.6% Fibonacci retracement level of its recent decline.
Resistance and Support Levels

Ethereum is trading below $1,850 and the 100-hour moving average, with resistance at $1,865. A breakout above this level could push ETH toward $1,920 and $1,950. A move past $1,950 might fuel a rally toward $2,000 or even $2,050. On the downside, a failure to hold $1,800 could see ETH retesting $1,780 and potentially dropping to $1,720 or lower.
Read Ethereum Price Prediction for more detailed insights
Market Sentiment and MVRV Ratio
Ethereum’s MVRV ratio, which compares market value to realized value, is at 0.88. This suggests ETH is nearing an overheated phase, historically leading to corrections. ETH is down 44% year-to-date, and futures premiums remain below the neutral 5% threshold, indicating weak bullish sentiment.
Also Read: IOTA Price Prediction 2025, 2026 – 2030
Derivatives and ETF Impact
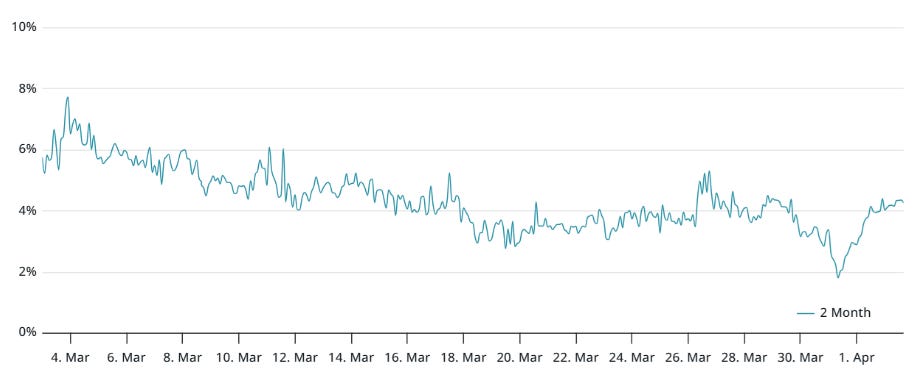
The ETH options market shows risk aversion, with a 25% delta skew at 7%, signaling caution among traders. Meanwhile, retail traders remain neutral, as perpetual futures funding rates have been stable. Spot ETH ETFs have recorded $37 million in net outflows in the last two weeks, dampening enthusiasm.

Ethereum faces key resistance at $1,865, with potential upside to $1,950. However, weak derivatives data and ETF outflows suggest cautious sentiment. Traders should watch key levels closely as market conditions evolve.