


What’s Next for Ethereum After 20% Drop?
Is Ethereum Price About to Break $4,000 Again?

Ethereum (ETH) experienced a sharp decline last week, closing below the critical $2,125 support level and falling nearly 20%. On Monday, ETH traded around $2,051, with bearish momentum indicating a potential retest of the $1,905 support level.
Key Technical Indicators:
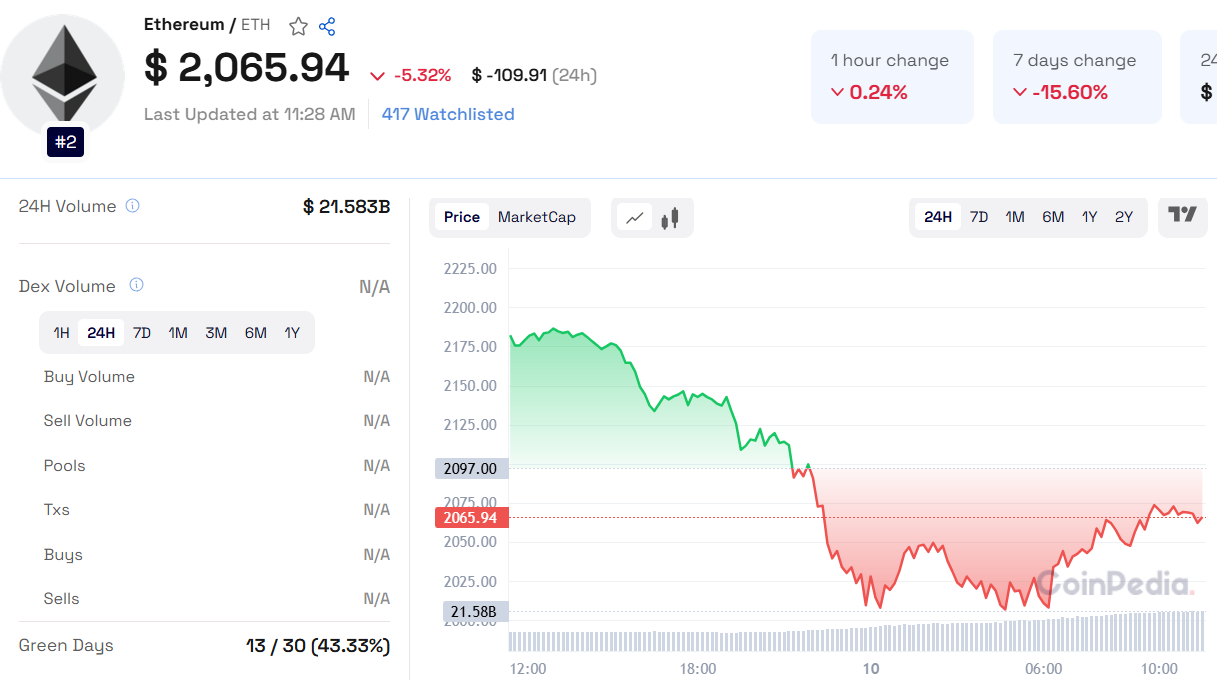
RSI: The daily chart’s Relative Strength Index (RSI) is at 35, showing bearish momentum after rejecting its neutral level of 50.
MACD: Bearish crossover last week suggests the continuation of a downtrend.
Price Scenarios:
Bearish Case: If the downtrend continues, ETH could test support at $1,905.
Bullish Case: A recovery above $2,125 might push ETH towards $2,359 resistance.
Read ETH Price Prediction for 2025, 2026, - 2030 for more detailed insights
Historical Performance:
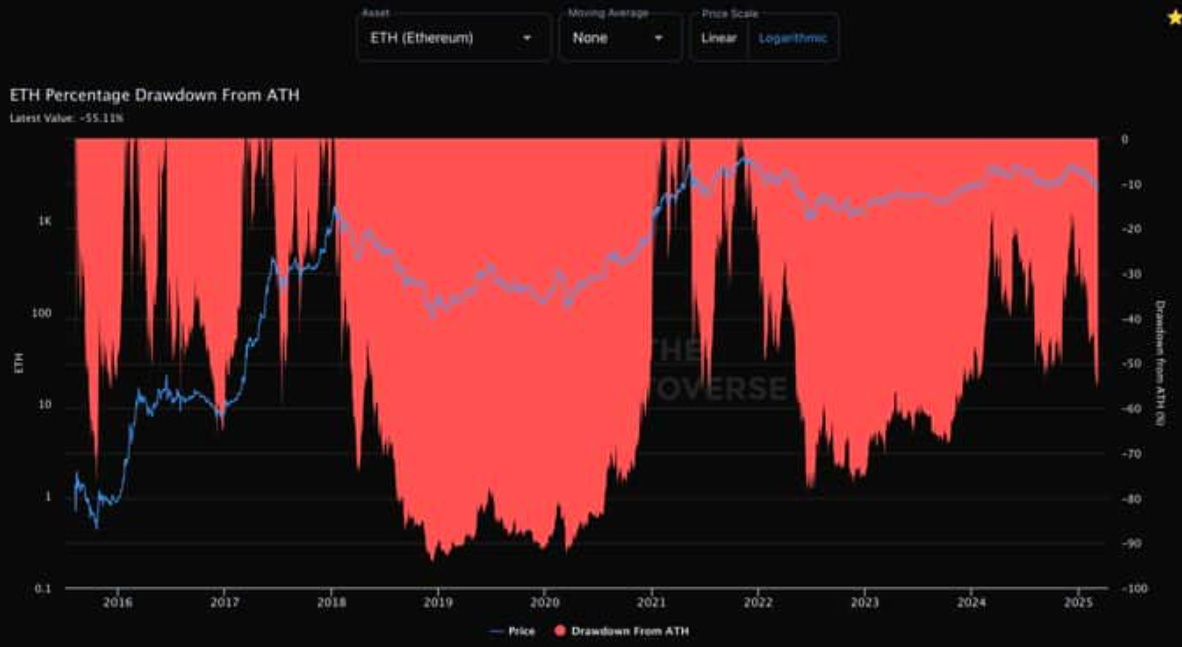
2022 Bear Market: ETH dropped -80% post-FTX collapse but showed resilience with a 53.11% drawdown stabilization at $2,300 in March 2025.
Previous Patterns: ETH endured -70% and -60% drawdowns in 2018 and 2021, both followed by strong recoveries.
Market Catalysts:
2024 Dencun Upgrade & ETF Approvals: Boosted ETH’s recovery and reinforced long-term strength.
Whale Accumulation: Increased confidence during price dips.
Future Projections:
Potential ATH Breakout: If ETH rallies to $3,000-$4,164.
Risk of Drawdown: Regulatory issues or market manipulation could cause a -40% to -50% correction.
Also Read: THORChain Price Prediction 2025, 2026 – 2030
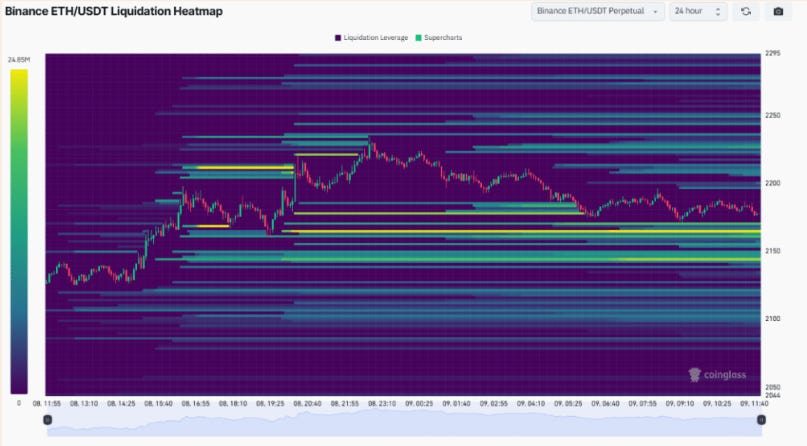
Volatility Insights:
Binance Liquidation Heatmap: Shows trading between $2,050 and $2,250, mirroring historical volatility.
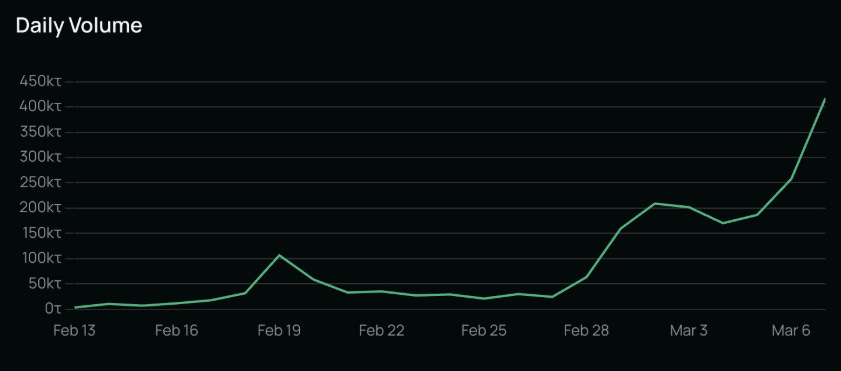
Volume Trends: Between February 13 and March 6, volume surged from 50k to 450k, showing rising investor interest.
Takeaway: Ethereum’s historical resilience and current market behavior suggest potential for a bullish recovery. However, traders should monitor regulatory developments and volume trends to navigate potential volatility.