


Ethereum Price Eyes $4100 Amid Massive Institutional Accumulation
Is Ethereum price ready for a bullish breakout?

Ethereum’s price action has been a focal point for traders and investors, especially as it navigates crucial support and resistance levels. This article breaks down the latest market movements, key metrics, and what they mean for Ethereum’s future price trajectory.
Key Support Found at $3,133
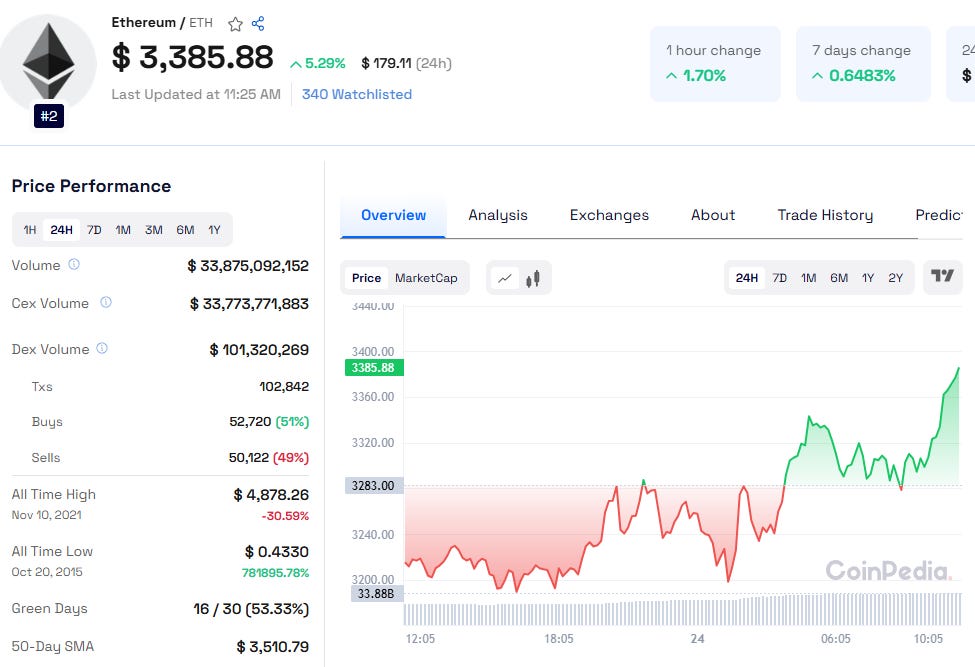
Ethereum recently tested its 200-day Exponential Moving Average (EMA) at $3,133, a critical support level for the cryptocurrency. After dipping to this level on Sunday, ETH rebounded by 3.83% over the next four days and is currently trading near $3,310.
If Ethereum closes below the $3,133 support, the price could slide further to test the psychological level of $3,000. However, holding above this EMA could fuel a recovery, with potential resistance at $3,730.
Read detailed Ethereum Price Prediction 2040 for more insights
Indicators Signal Weak Momentum
Technical indicators are painting a cautious picture:
RSI: The Relative Strength Index is at 47, below the neutral threshold of 50, signaling weakening bullish momentum.
MACD: The Moving Average Convergence Divergence indicator shows convergence, highlighting indecision in the market.
Institutional Activity and Market Sentiment
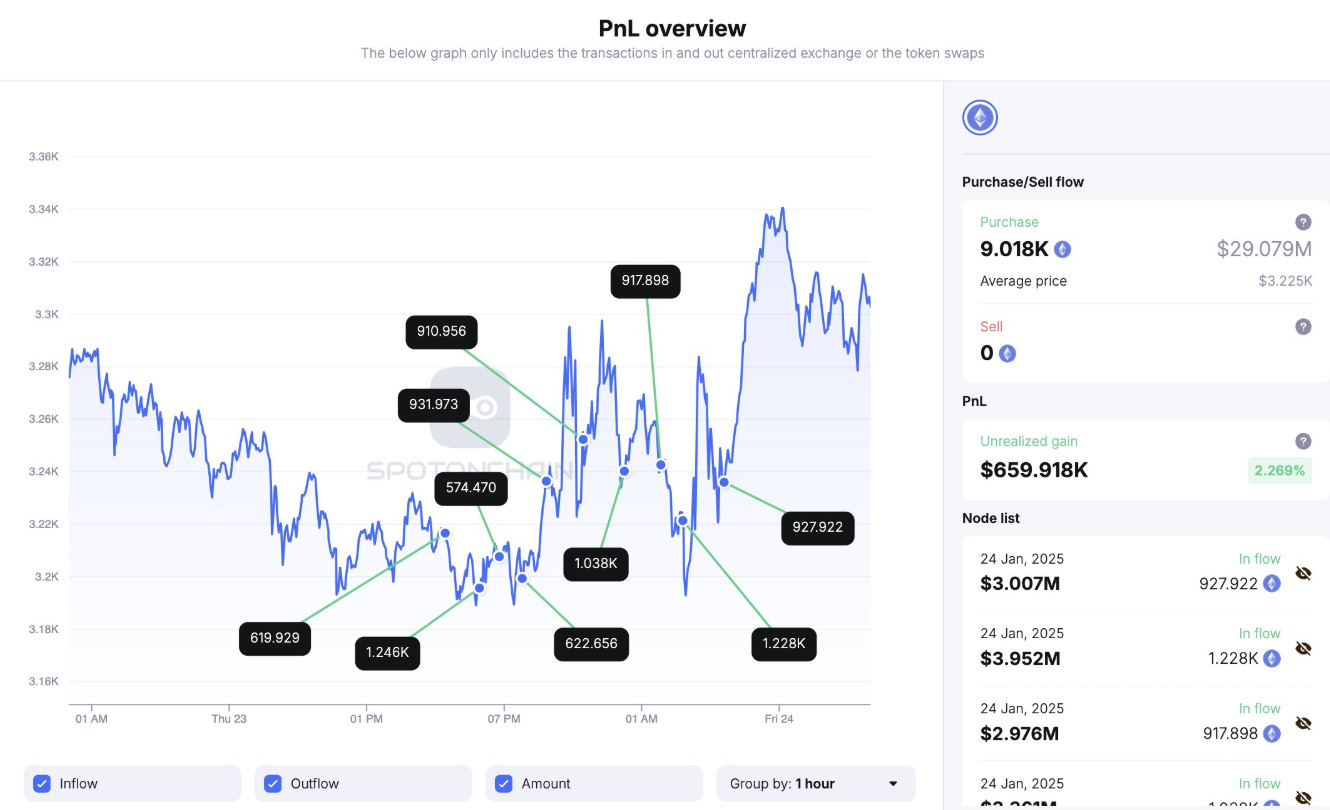
Recent on-chain activity highlights significant institutional interest in Ethereum. According to Spot On Chain, an entity transferred $29.2 million USDT into HTX and withdrew 9,018 ETH at an average price of $3,237.5. This strategic move during a market dip suggests growing confidence in Ethereum’s long-term potential.
Also Read: Sei Price Prediction 2030
Options Market Insights
Options market dynamics are set to play a significant role in ETH’s short-term price action:
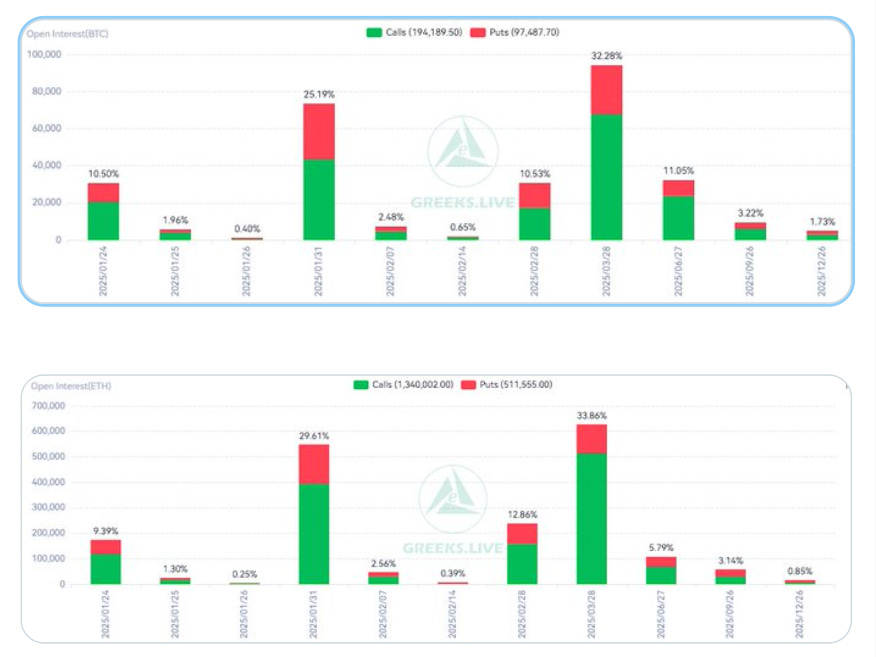
31,000 BTC options and 174,000 ETH options will expire on January 24.
The Put Call Ratio for ETH stands at 0.47, indicating bullish sentiment.
ETH’s Maxpain point is $3,300, aligning closely with its current trading range.
This data signals optimism among traders and could influence market movements in the coming days.
Leverage Ratio: A Double-Edged Sword
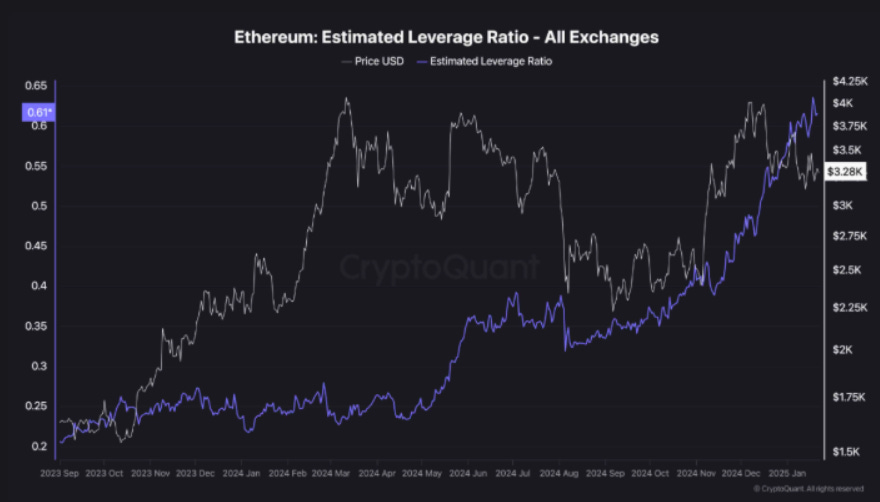
Ethereum’s Estimated Leverage Ratio (ELR) has risen to 0.61, the highest in months, according to CryptoQuant. This increase reflects heightened investor confidence, but it also comes with risks:
High leverage can amplify price swings, especially during consolidation phases.
A sudden shift in sentiment could trigger cascading liquidations, leading to sharp price movements.
Consolidation and the Road Ahead
Since early 2024, Ethereum has been trading within a narrow range of $3,200 to $3,500. This consolidation phase, combined with high leverage, sets the stage for a potential breakout.
Key Scenarios to Watch
Bullish Breakout: Holding above $3,133 and breaking resistance at $3,730 could push ETH higher, potentially revisiting its all-time high.
Bearish Scenario: A close below $3,133 could trigger a decline to $3,000 or lower.
Future Ethereum Price Predictions
Analysts remain optimistic about Ethereum’s long-term prospects:
Ethereum Price Prediction 2025: Continued growth in institutional adoption and decentralized applications could drive ETH to new highs.
Ethereum Price Prediction 2030: With increasing dominance in the derivatives market and blockchain innovation, ETH could surpass its current records.